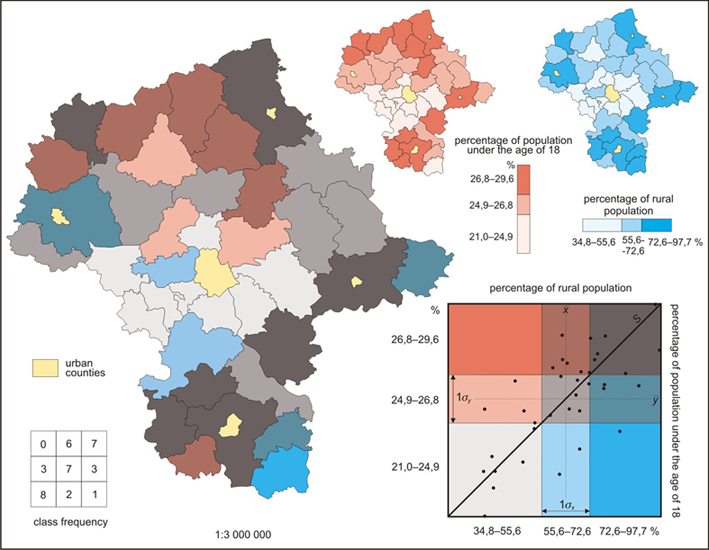
Bivariate Choropleth maps are distinct in that they compare two variables. In this map percentage of rural population and percentage of population under 18 is compared. Bivariate maps can be hard to read becuase of the variation of color. Population of rural population is represented by blues while percentage of population under 18 is red. When combined, the two data set create different colors which are hard to read and/or could easily be misinterpreted.
No comments:
Post a Comment