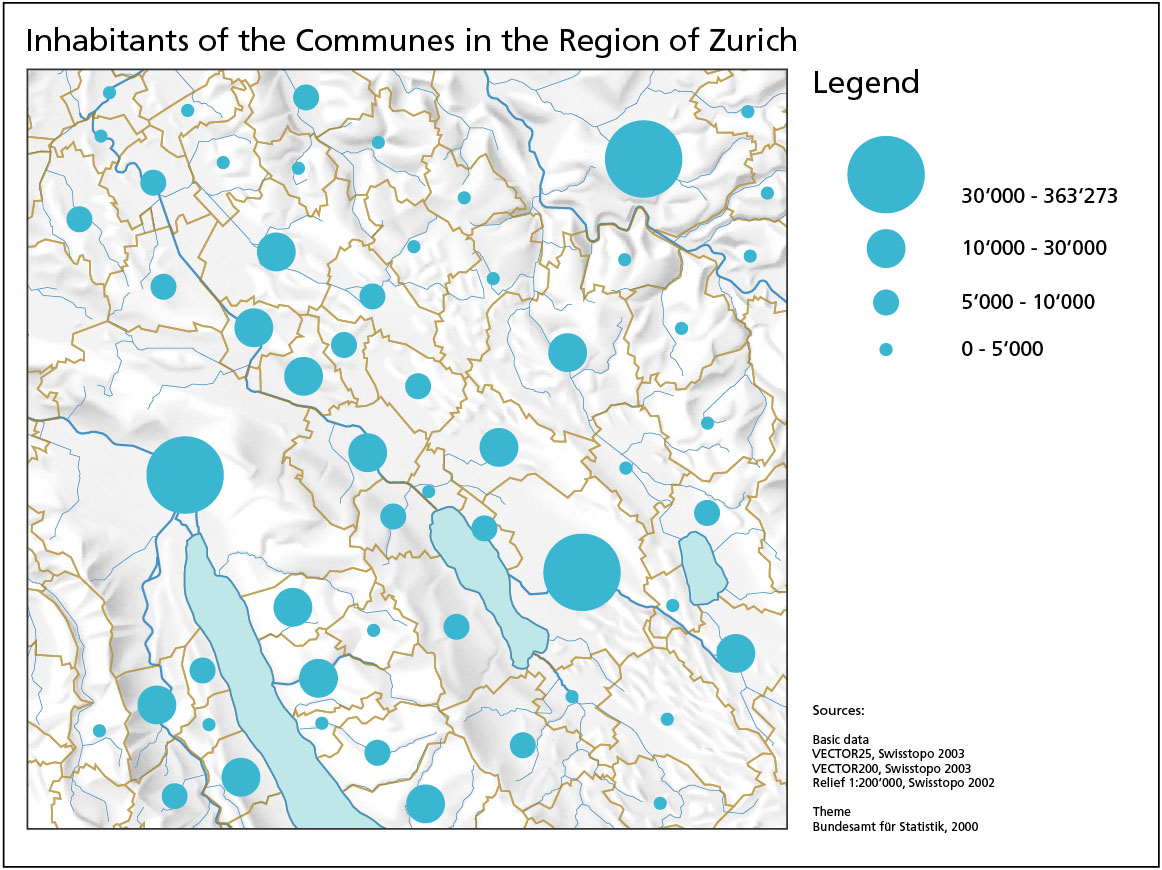
A range graded proportional map portrays data by only using a set amount of circles to represent the data. This map conveys the inhabitant population in Zurich. The scale only uses four circle sizes to portray the data. The largest circle represents the largest population while the smallest circle represents the smallest amounts of inhabitants.

No comments:
Post a Comment